123456789101112131415161718192021222324252627282930313233343536373839404142434445464748495051525354555657585960616263646566676869 |
"""演示26: 评价指标体系 — 混淆矩阵 / Precision-Recall / ROC-AUC。

对一组模拟的二分类预测(含正负例与不同阈值), 画出:
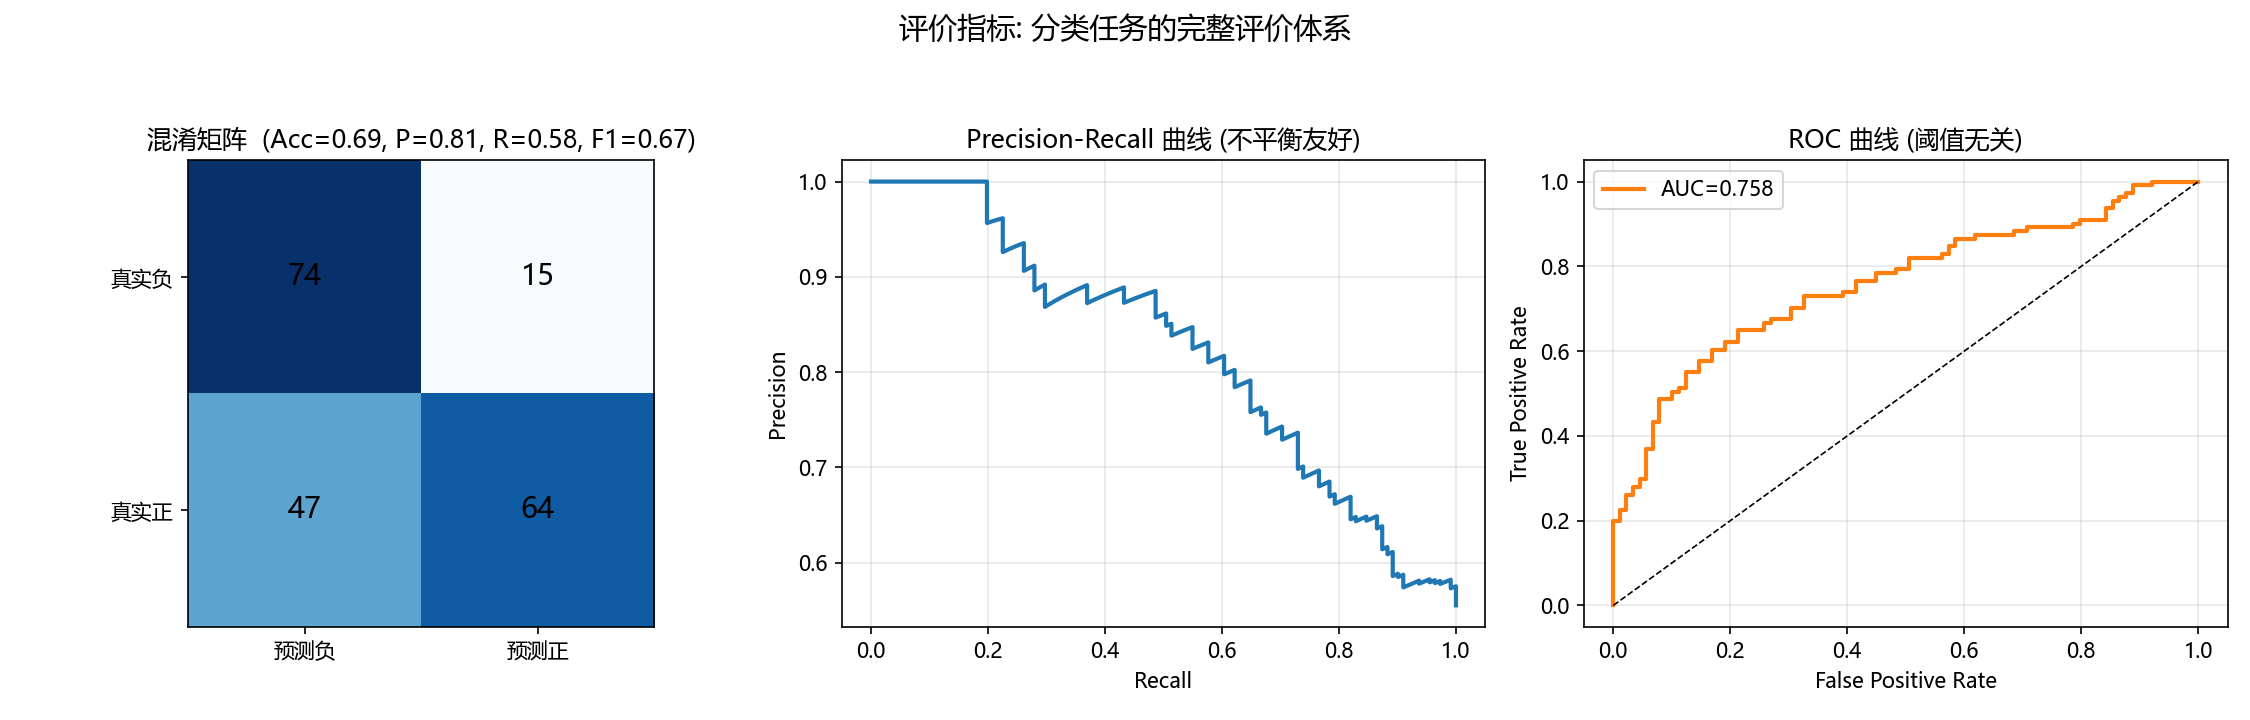
- 混淆矩阵 + 四大指标(P/R/F1/Acc);
- Precision-Recall 曲线 与 ROC 曲线(AUC)。
"""
import os
import numpy as np
import matplotlib.pyplot as plt
from sklearn.metrics import confusion_matrix, precision_recall_curve, roc_curve, auc
from sklearn.datasets import make_classification
from sklearn.model_selection import train_test_split
from sklearn.linear_model import LogisticRegression
from figure_style import figures_dir, configure

configure()

OUT = figures_dir()
os.makedirs(OUT, exist_ok=True)

X, y = make_classification(n_samples=400, n_features=4, n_informative=2,
                           n_redundant=0, random_state=0, class_sep=0.6)
Xtr, Xte, ytr, yte = train_test_split(X, y, test_size=0.5, random_state=0)
clf = LogisticRegression().fit(Xtr, ytr)
proba = clf.predict_proba(Xte)[:, 1]
pred = (proba >= 0.5).astype(int)

cm = confusion_matrix(yte, pred)
tn, fp, fn, tp = cm.ravel()
precision = tp / (tp + fp); recall = tp / (tp + fn)
f1 = 2 * precision * recall / (precision + recall + 1e-9)
acc = (tp + tn) / (tp + tn + fp + fn)

fig, axes = plt.subplots(1, 3, figsize=(15, 4.8))

# ① 混淆矩阵
ax = axes[0]
im = ax.imshow(cm, cmap="Blues")
ax.set_xticks([0, 1]); ax.set_yticks([0, 1])
ax.set_xticklabels(["预测负", "预测正"]); ax.set_yticklabels(["真实负", "真实正"])
for i in range(2):
    for j in range(2):
        ax.text(j, i, cm[i, j], ha="center", va="center", fontsize=14, color="k")
ax.set_title(f"混淆矩阵  (Acc={acc:.2f}, P={precision:.2f}, R={recall:.2f}, F1={f1:.2f})")

# ② PR 曲线
ax = axes[1]
pr, re, _ = precision_recall_curve(yte, proba)
ax.plot(re, pr, "tab:blue", lw=2)
ax.set_xlabel("Recall"); ax.set_ylabel("Precision")
ax.set_title("Precision-Recall 曲线 (不平衡友好)")
ax.grid(alpha=0.3)

# ③ ROC 曲线
ax = axes[2]
fpr, tpr, _ = roc_curve(yte, proba)
roc_auc = auc(fpr, tpr)
ax.plot(fpr, tpr, "tab:orange", lw=2, label=f"AUC={roc_auc:.3f}")
ax.plot([0, 1], [0, 1], "k--", lw=0.8)
ax.set_xlabel("False Positive Rate"); ax.set_ylabel("True Positive Rate")
ax.set_title("ROC 曲线 (阈值无关)")
ax.legend(); ax.grid(alpha=0.3)

fig.suptitle("评价指标: 分类任务的完整评价体系", fontsize=14)
fig.tight_layout(rect=(0, 0, 1, 0.93))
out = os.path.join(OUT, "fig_train_metrics.png")
fig.savefig(out, dpi=150)
print(f"Acc={acc:.2f} P={precision:.2f} R={recall:.2f} F1={f1:.2f} AUC={roc_auc:.3f} -> {out}")
|