1234567891011121314151617181920212223242526272829303132333435363738394041424344454647484950515253545556575859606162 |
"""演示3: RANSAC 从含大量离群噪声中稳健拟合直线。

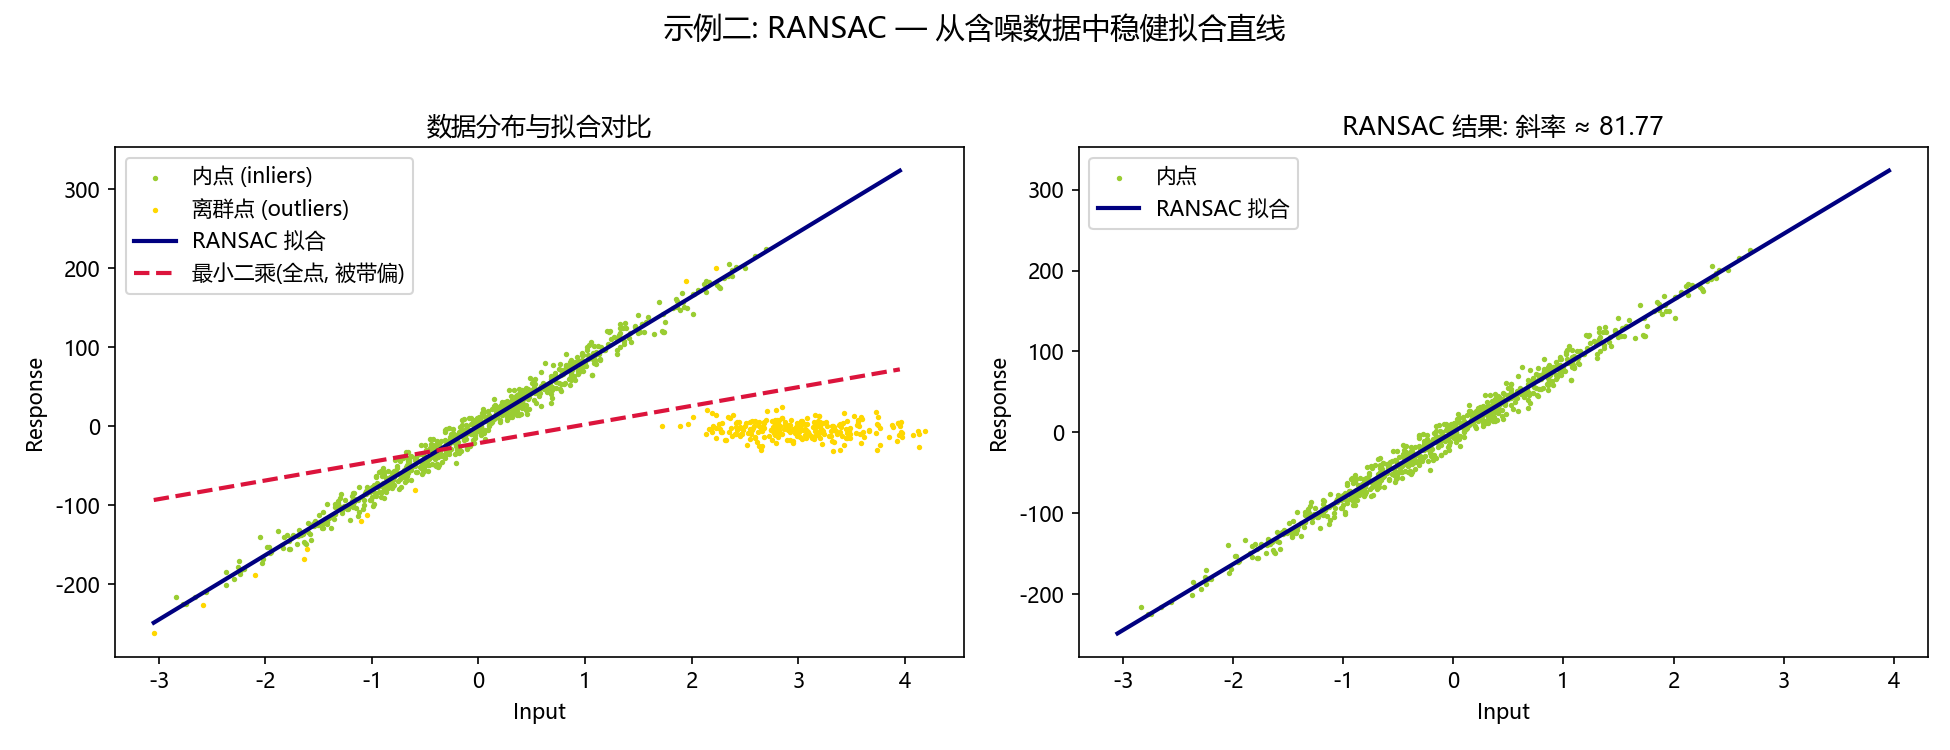
对比: 普通最小二乘(被离群点带偏) vs RANSAC(忽略离群点, 拟合主流数据)。
"""
import os
import numpy as np
import matplotlib.pyplot as plt
from sklearn import linear_model, datasets
from sklearn.linear_model import LinearRegression
from figure_style import figures_dir, configure

configure()

OUT = figures_dir()
os.makedirs(OUT, exist_ok=True)

n_samples = 1000
n_outliers = 250                       # 大量离群点
X, y, coef = datasets.make_regression(n_samples=n_samples, n_features=1,
                                      n_informative=1, noise=10, coef=True,
                                      random_state=0)

np.random.seed(0)
X[:n_outliers] = 3 + 0.5 * np.random.normal(size=(n_outliers, 1))
y[:n_outliers] = -3 + 10 * np.random.normal(size=n_outliers)

# ---- RANSAC 稳健拟合 ----
ransac = linear_model.RANSACRegressor(random_state=42)
ransac.fit(X, y)
inlier_mask = ransac.inlier_mask_
outlier_mask = np.logical_not(inlier_mask)

# ---- 普通最小二乘(对比): 直接对全部点拟合(会被离群点带偏) ----
lsq_all = LinearRegression()
lsq_all.fit(X, y)

line_X = np.arange(X.min(), X.max())[:, np.newaxis]
y_ransac = ransac.predict(line_X)
y_lsq_all = lsq_all.predict(line_X)

fig, (ax1, ax2) = plt.subplots(1, 2, figsize=(13, 5))

ax1.scatter(X[inlier_mask], y[inlier_mask], c="yellowgreen", marker=".", s=10, label="内点 (inliers)")
ax1.scatter(X[outlier_mask], y[outlier_mask], c="gold", marker=".", s=10, label="离群点 (outliers)")
ax1.plot(line_X, y_ransac, c="navy", lw=2, label="RANSAC 拟合")
ax1.plot(line_X, y_lsq_all, c="crimson", lw=2, ls="--", label="最小二乘(全点, 被带偏)")
ax1.legend(); ax1.set_xlabel("Input"); ax1.set_ylabel("Response")
ax1.set_title("数据分布与拟合对比")

ax2.scatter(X[inlier_mask], y[inlier_mask], c="yellowgreen", marker=".", s=10, label="内点")
ax2.plot(line_X, y_ransac, c="navy", lw=2, label="RANSAC 拟合")
ax2.set_xlabel("Input"); ax2.set_ylabel("Response")
ax2.set_title(f"RANSAC 结果: 斜率 ≈ {ransac.estimator_.coef_[0]:.2f}")
ax2.legend()

fig.suptitle("示例二: RANSAC — 从含噪数据中稳健拟合直线", fontsize=14)
fig.tight_layout(rect=(0, 0, 1, 0.95))
out_path = os.path.join(OUT, "fig_ransac_line.png")
fig.savefig(out_path, dpi=150)
print(f"RANSAC 斜率 {ransac.estimator_.coef_[0]:.2f}, "
      f"内点数 {inlier_mask.sum()} -> {out_path}")
|