123456789101112131415161718192021222324252627282930313233343536373839404142434445464748495051525354555657585960616263646566676869707172737475767778798081828384858687888990919293949596979899100101102103104105106107108109 |
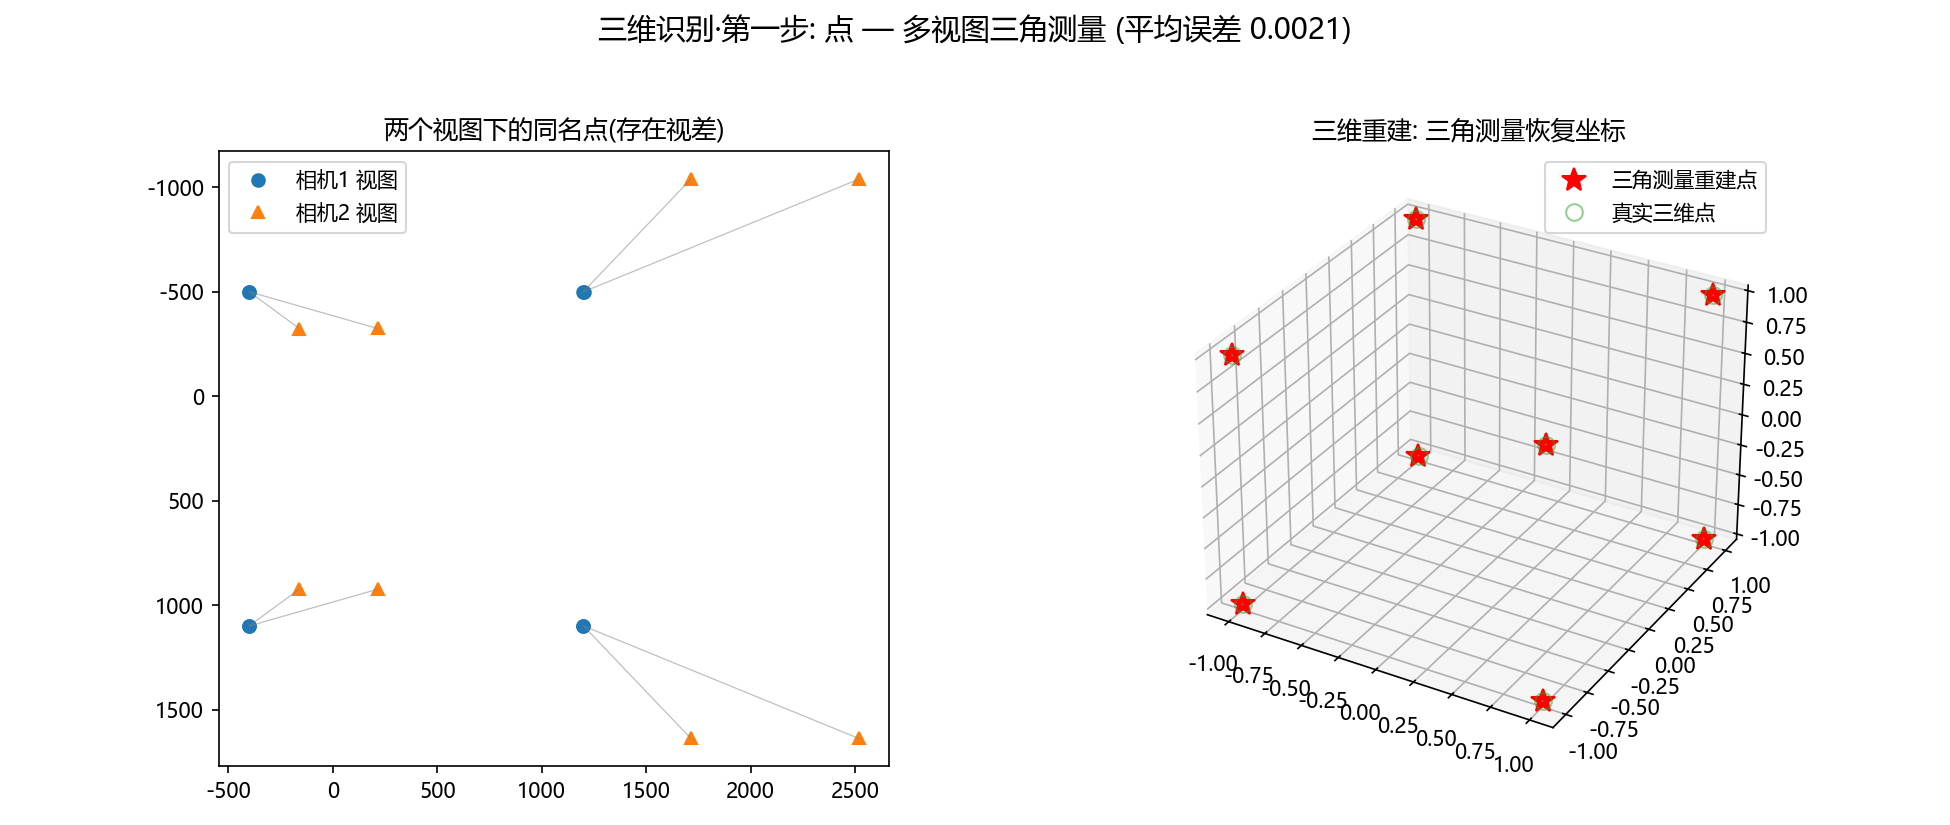
"""演示7: 点 — 多视图三角测量恢复三维坐标。

模拟两台相机从不同角度观察一个"正方体角点"点云, 用对极几何/DLT 三角化
从两视图同名点恢复三维坐标, 并与真实值对比误差。
"""
import os
import numpy as np
import matplotlib.pyplot as plt
from figure_style import figures_dir, configure

configure()

OUT = figures_dir()
os.makedirs(OUT, exist_ok=True)

rng = np.random.default_rng(42)

# ---- 真实三维点: 一个立方体的 8 个顶点 ----
half = 1.0
true_pts = np.array([[x, y, z]
                     for x in (-half, half)
                     for y in (-half, half)
                     for z in (-half, half)])

# ---- 两台相机: 内参 K, 外参 (R, t), 投影矩阵 P = K[R|t] ----
K = np.array([[800, 0, 400],
              [0, 800, 300],
              [0, 0, 1]])


def make_camera(R, t):
    Rt = np.hstack([R, t.reshape(-1, 1)])
    return K @ Rt


R1 = np.eye(3)
t1 = np.array([0.0, 0.0, 0.0])          # 相机1: 原点看向 +z
P1 = make_camera(R1, t1)

# 相机2: 绕 y 轴转 20 度, 并平移 (0.3, 0, 0)
ang = np.radians(20)
R2 = np.array([[np.cos(ang), 0, np.sin(ang)],
               [0, 1, 0],
               [-np.sin(ang), 0, np.cos(ang)]])
t2 = np.array([0.3, 0.0, 0.0])
P2 = make_camera(R2, t2)


def project(P, pts):
    """把三维点投影到相机像素平面, 返回齐次坐标的二维点。"""
    ph = (P @ np.hstack([pts, np.ones((len(pts), 1))]).T).T
    return ph[:, :2] / ph[:, 2:3]


# 两个视图的投影(加入少量像素噪声模拟匹配误差)
u1 = project(P1, true_pts) + rng.normal(0, 0.3, (len(true_pts), 2))
u2 = project(P2, true_pts) + rng.normal(0, 0.3, (len(true_pts), 2))


def triangulate(P1, P2, u1, u2):
    """DLT 线性三角化: 对每个点求解齐次线性方程组 A X = 0。"""
    pts3d = []
    for (x1, y1), (x2, y2) in zip(u1, u2):
        A = np.array([
            x1 * P1[2] - P1[0],
            y1 * P1[2] - P1[1],
            x2 * P2[2] - P2[0],
            y2 * P2[2] - P2[1],
        ])
        _, _, Vt = np.linalg.svd(A)
        X = Vt[-1]
        pts3d.append(X[:3] / X[3])
    return np.array(pts3d)


rec_pts = triangulate(P1, P2, u1, u2)
err = np.linalg.norm(rec_pts - true_pts, axis=1)
print(f"三维重建误差: 平均 {err.mean():.4f}, 最大 {err.max():.4f}")

# ---- 可视化 ----
fig = plt.figure(figsize=(13, 5.5))

ax1 = fig.add_subplot(1, 2, 1)
ax1.plot(u1[:, 0], u1[:, 1], "o", c="tab:blue", label="相机1 视图")
ax1.plot(u2[:, 0], u2[:, 1], "^", c="tab:orange", label="相机2 视图")
for i in range(len(true_pts)):
    ax1.plot([u1[i, 0], u2[i, 0]], [u1[i, 1], u2[i, 1]],
             "-", c="gray", lw=0.6, alpha=0.5)   # 同名点连线(视差)
ax1.set_title("两个视图下的同名点(存在视差)"); ax1.legend()
ax1.invert_yaxis(); ax1.set_aspect("equal")

ax2 = fig.add_subplot(1, 2, 2, projection="3d")
ax2.plot(rec_pts[:, 0], rec_pts[:, 1], rec_pts[:, 2], "r*", ms=12, label="三角测量重建点")
ax2.plot(true_pts[:, 0], true_pts[:, 1], true_pts[:, 2], "o", c="tab:green", alpha=0.5,
         label="真实三维点", mfc="none", ms=8)
for i in range(len(true_pts)):
    ax2.plot([rec_pts[i, 0], true_pts[i, 0]],
             [rec_pts[i, 1], true_pts[i, 1]],
             [rec_pts[i, 2], true_pts[i, 2]], "-", c="gray", lw=0.7)
ax2.set_title("三维重建: 三角测量恢复坐标")
ax2.legend()

fig.suptitle("三维识别·第一步: 点 — 多视图三角测量 (平均误差 {:.4f})".format(err.mean()),
             fontsize=14)
fig.tight_layout(rect=(0, 0, 1, 0.95))
out_path = os.path.join(OUT, "fig_3d_triangulation.png")
fig.savefig(out_path, dpi=150)
print(f"-> {out_path}")
|